We closed our fund 1 for Untapped Capital!
When we started, we be benefited greatly from content shared by other VCs like Elizabeth Yin. We wanted to do the same, so analyzed our fundraising data to share with you. Let’s dig in 👇
As a caveat, every firm’s journey is different, so this is at best a data point for future emerging managers. As our data will show, we took a long and steady network based approach. 4 mo pre-raise, 9 mo raise til first close, and 18 mo between first and final… total: 31 months.
For context, I started this raise as a solo GP and joined forces w Jessica Jackely before our first close. Both with VC experience but neither with attributable track records. For some further context, you can learn about our fund here.
1185 Meetings Tracked
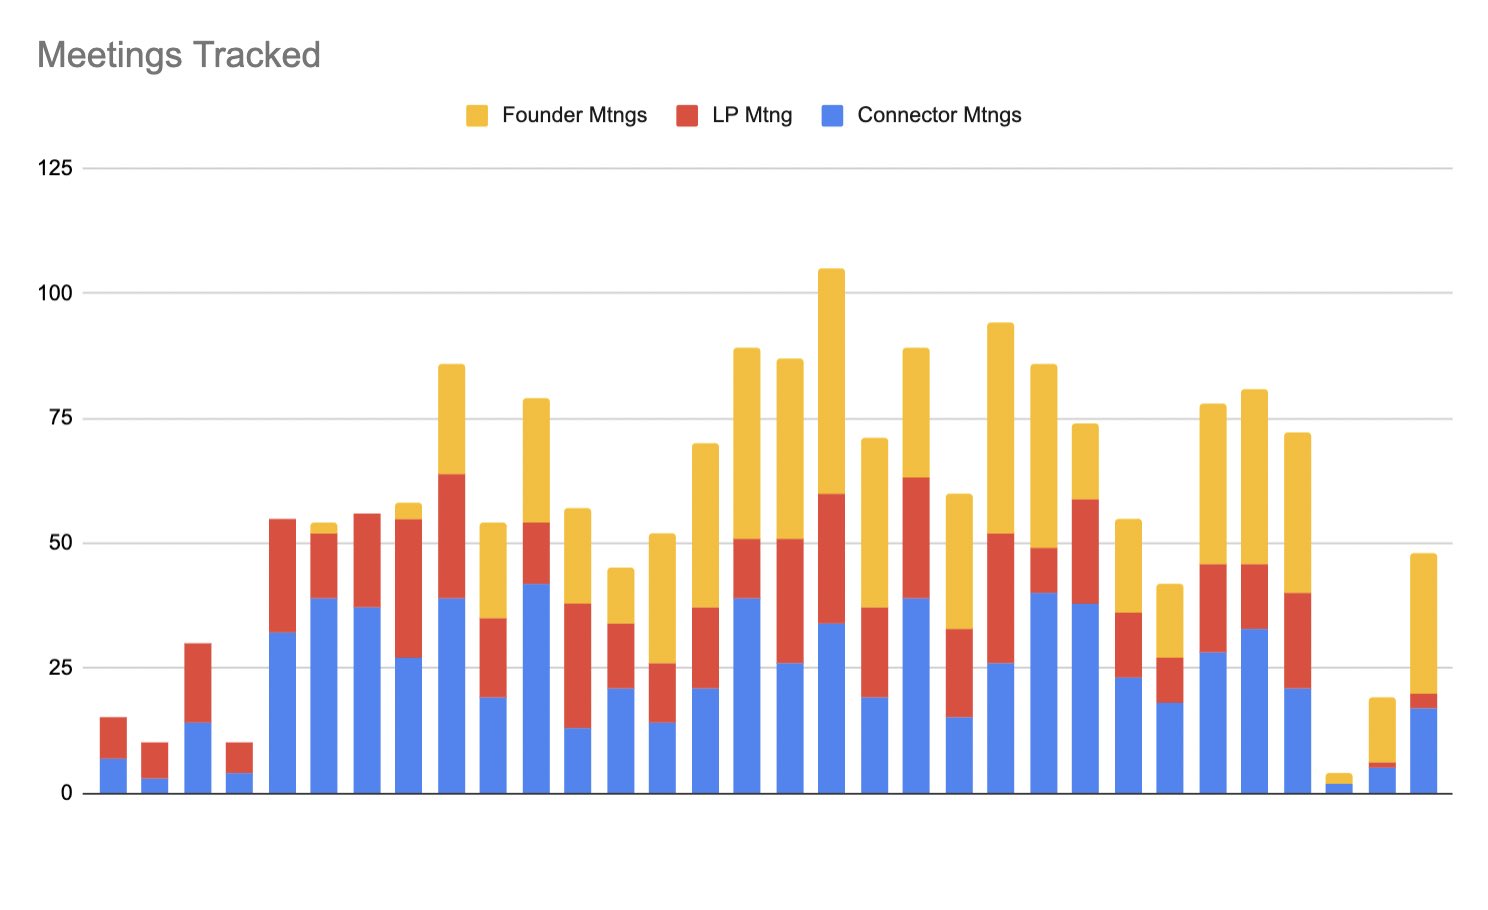
Diving into the data, the above chart shows the number of meetings we tracked.* We tracked 1185 mtngs total: 494 LP mtngs, 636 founder mtngs, 755 connector mtngs.
*an underestimate since we’re not perfect about tracking.
For the sake of this analysis, “connector” is anybody who is neither LP nor founder. This includes fellow VCs, friends, service providers, and more. I called our fundraise style “network based” earlier because the first chunk was a lot of catching up with friends.
939 Relationships Tracked
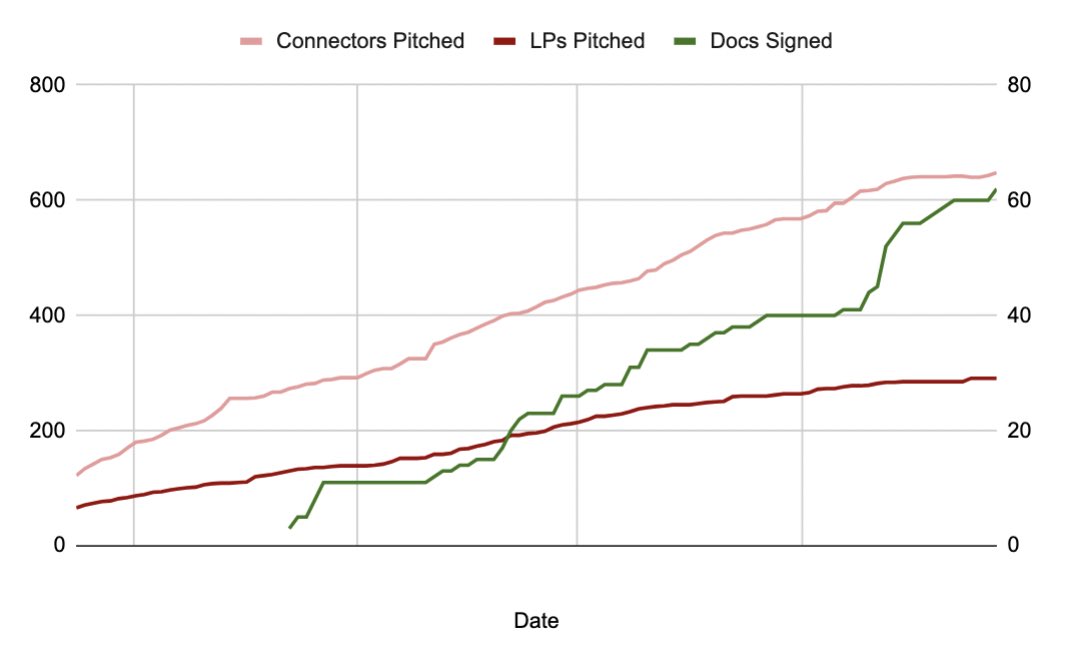
This chart tracks the unique number of people we met (LP & connector), against the number of LPs signed on. We met a total of 638 connectors and 291 LPs (939 people), averaging 7 new connectors and 2 new LPs a week.
Conversion Rate: 21.31%
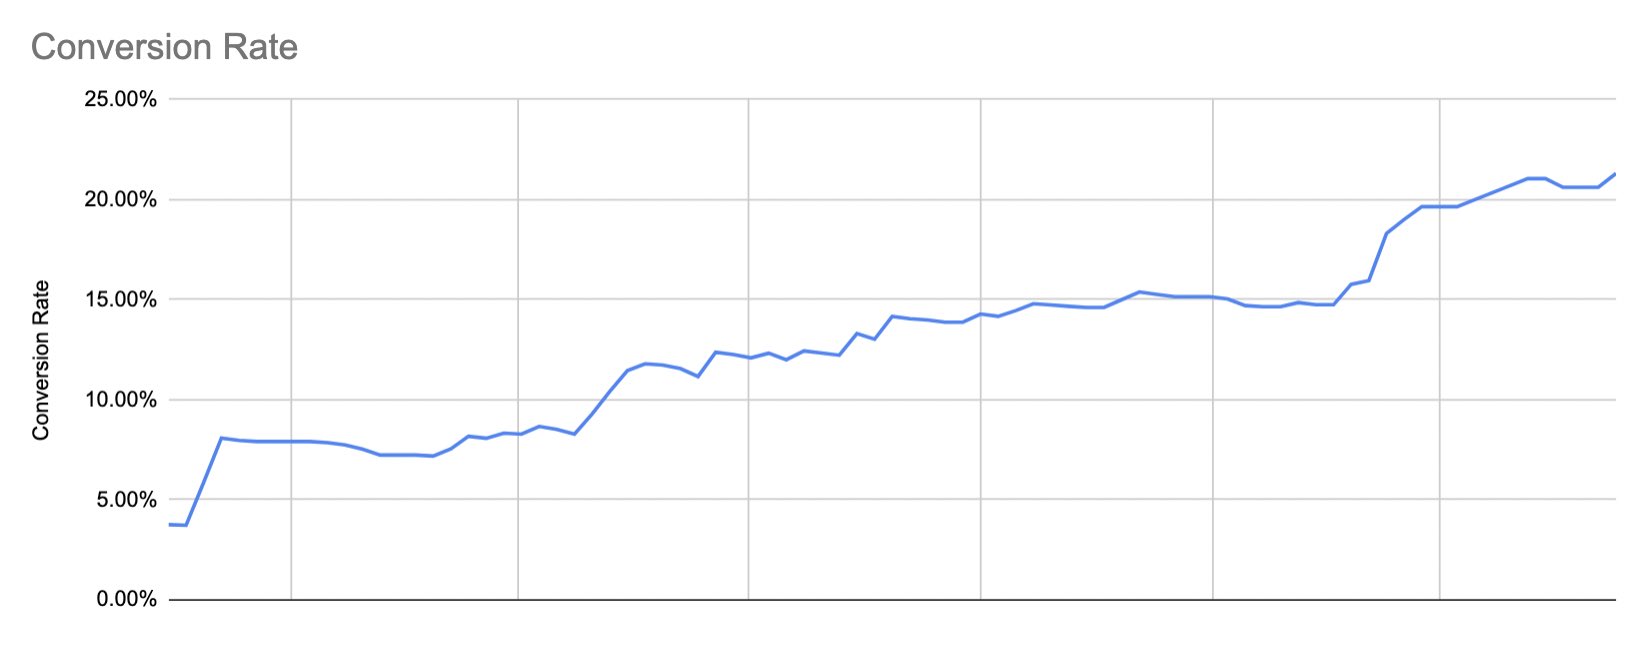
Interestingly, if you look at the conversion rate of LPs met to signed, you see a steady increase from our first close (>5%) ending at 21.31% (1 in 5 LPs). This steady increase was largely due to LPs we met earlier, committing later in our raise.
Top of Funnel (1254 LPs total)
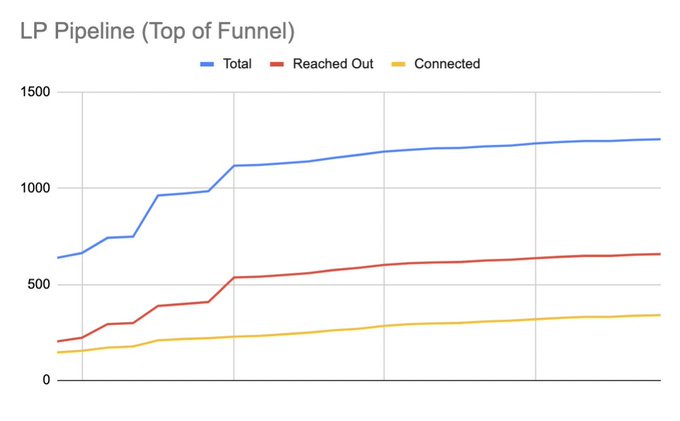
Looking further up the funnel, we started with 638 LPs on our list and ended with 1254. We reached out to 657 (~52%), connected with 340 (~51%), and met with 260 of them (~76%). *The earlier 291 LPs were unique people, this 260 is LP accounts.
LP Source Breakdown
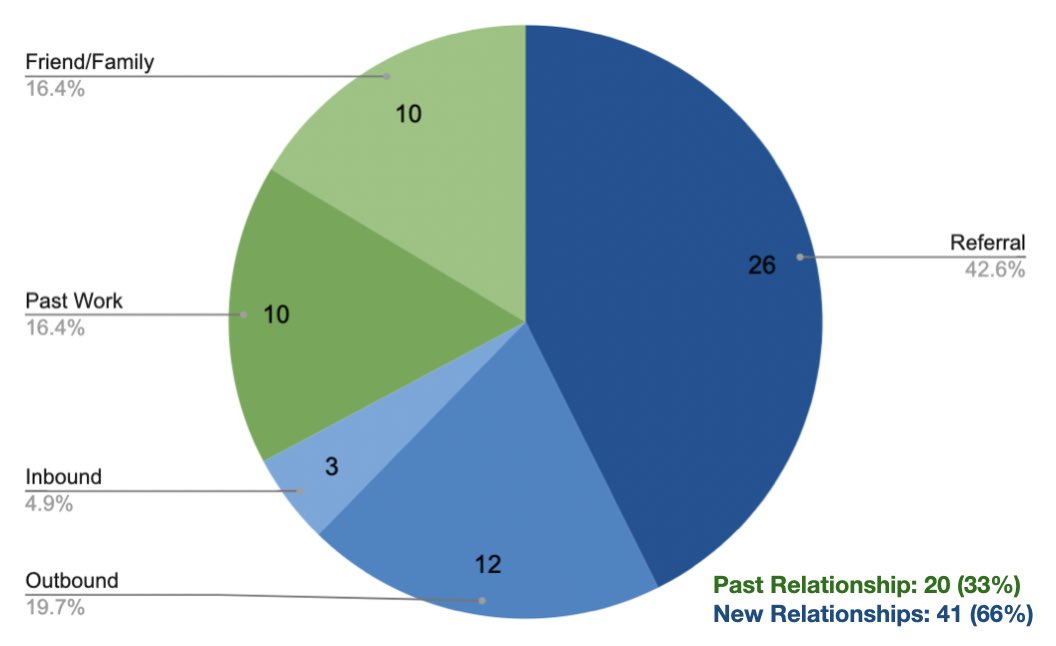
Now looking at our LP base, you’ll see 1/3 are from existing relationships and 2/3 were new relationships we built during our raise. Of new relations: 2/3 referral, 1/3 mostly outbound (some inbound). Of existing relations: 1/2 past work, 1/2 personal – this is a fuzzy line.
Referral Source Breakdown
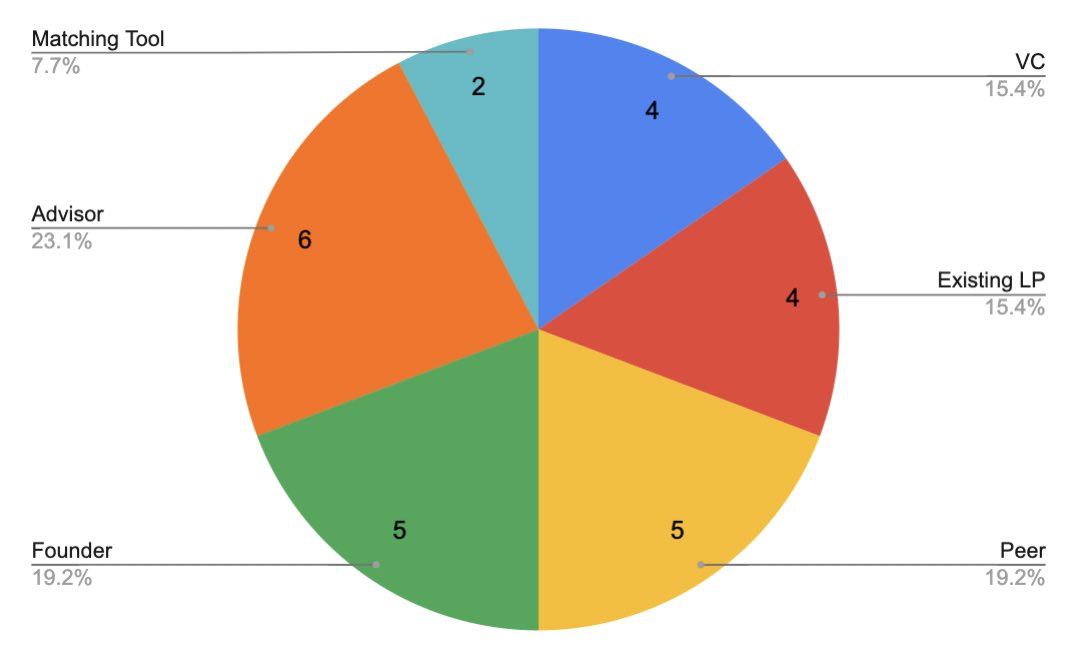
Digging specifically into our referral sources, you’ll see it was a healthy mix of VCs, existing LPs, founders, friends, our advisor, and 2 from @lolitataub’s LP-GP matching tool. This data reflects our experience that referrals came from a variety of unexpected places.
Outbound/Inbound Source Breakdown
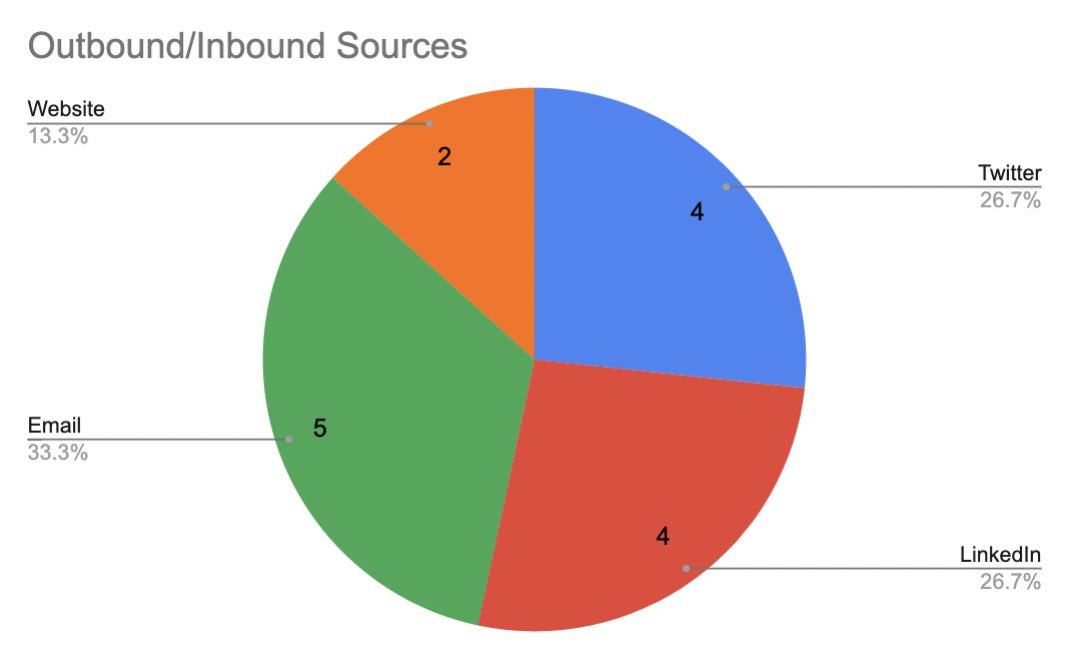
Outbound/inbound relationships are truly new. We were curious where we connected with them and found again that it was a healthy mix: Twitter, LinkedIn, Cold Email, Website Form. This reflects our experience that it wasn’t one strategy that worked best for us.
Number of Meetings per LP
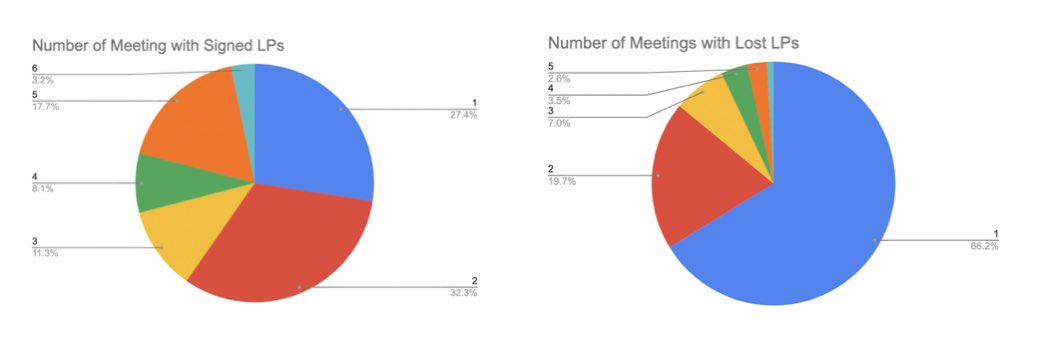
We’ll end this by looking at number of meetings it took to close an LP. 2/3 of LPs we closed after 1 or 2 mtngs, while a handful took 5 or more. Of LPs we didn’t close, 2/3 ended at one meeting – but there were a handful we met multiple times but couldn’t close.
More…
Again, this is the story of just one firm, but hopefully helpful to some future emerging managers.
Some further readings:
Leave a Reply